
 Shiina Labs
I did not plan to build a chart library.
ChartLens started as code inside WiFi Lens. I needed charts for Wi-Fi spectrum views, RSSI trends, roaming timelines, and a few interactive screens. Each chart looked different in the UI, but the same problems kept showing up in the code.
I had to convert data values into screen positions. I had to keep axis labels from crowding the plot. I had to draw curves, fill areas, handle hover, support drag-to-zoom, connect overview charts to detail charts, and place labels or tooltips on top of business data.
The first version lived where it needed to live: inside WiFi Lens. That worked while the app was small. Later, every new chart carried a familiar cost. I was not writing Wi-Fi logic anymore. I was rebuilding chart infrastructure.
That is when I pulled the code out.
The chart problem inside WiFi Lens
WiFi Lens is a native macOS Wi-Fi and Bluetooth analysis tool. It does not only list nearby networks. It tries to show users what the wireless environment looks like.
One chart shows channel occupancy across 2.4 GHz, 5 GHz, or 6 GHz. Another chart tracks the RSSI of one access point. A roaming test needs a timeline that marks AP handoffs. A spectrum view needs to draw channel width and signal strength together.
Those screens deal with Wi-Fi data, but the chart code deals with lower-level questions.
RSSI uses negative values, often around -90 dBm to -30 dBm. A spectrum chart has to map channel centers and widths onto pixels. A roaming timeline needs zooming over a long range. A channel chart may need SSID labels, hover tooltips, or selected states layered above the curve.
At first, I kept those details close to each screen. That helped me ship. Then the same fixes appeared in several places. A label fix in one chart did not help another chart. A hover behavior worked in one view, then needed to be rewritten in another. The chart code started to spread.
Why Swift Charts alone was not enough for this app
Swift Charts works well for many SwiftUI screens. I still like it for quick charts, static charts, and common visualizations.
WiFi Lens needed more control than those screens usually need.
I needed shared coordinate mapping across charts. I needed Canvas rendering for curves, fills, and markers. I needed interpolation modes such as Catmull-Rom, clamped cubic, step, and Gaussian. I needed hover logic that finds the nearest point by X position. I needed drag-to-zoom and range selection.
I also needed the parent view to own business state.
When a table selects an access point, the chart should reflect that selection. When the user hovers over a point, another panel may update. Some screens let the chart handle clicks. Other screens let the parent view decide what a click means.
I could keep building custom layers around Swift Charts in each screen. That would have made the product views larger and harder to reason about. So I made ChartLens responsible for the repeated chart work.
ChartLens does not wrap Swift Charts. It provides a SwiftUI chart rendering and interaction layer for the parts of WiFi Lens where I needed lower-level control.
Scope
I kept the scope small.
ChartLens focuses on the problems WiFi Lens already had:
- mapping data space to screen space;
- managing plotRect, annotationRect, and axis label regions;
- separating chart rendering from business overlays;
- keeping the API small while allowing new chart types;
- supporting hover, tap, zoom, and range selection in product screens.
I did not start by trying to cover every chart type. I started with behavior that already existed in WiFi Lens. That constraint helped. It kept the library tied to code I used, not use cases I imagined.
The library can grow later. For now, it needs to stay useful to the app that created it.
Removing Wi-Fi terms from the chart layer
The main extraction step was simple: remove Wi-Fi vocabulary from the chart layer.
WiFi Lens talks about APs, SSIDs, RSSI, channels, and bands. ChartLens should not know those words. It only needs a continuous Double domain.
The X value may mean time, frequency, channel number, or something else. The Y value may mean RSSI, speed, occupancy, or another product value. ChartLens only needs to know how to place those values on screen.
The basic model becomes:
ChartPoint
├─ x: position in a continuous domain, such as time, frequency, or channel number
└─ y: value at that position, such as RSSI, speed, or occupancy
A line chart only needs x and y. A candlestick chart can use a richer point with open, high, low, and close. The chart layer needs each point to provide its X position, its Y range, and a representative Y value for interaction.
That change made the code usable outside WiFi Lens. I was no longer extracting a Wi-Fi chart. I was extracting chart behavior that first appeared in a Wi-Fi app.
Overlay injection
Overlay injection became one of the most important boundaries.
The chart should calculate geometry and draw the base visual. Product UI should stay outside it. Tooltips, labels, threshold lines, heatmaps, and selected states belong to WiFi Lens or whichever app uses the chart.
The flow looks like this:
Create a chart
├─ pass in data series
├─ pass in axis and style configuration
└─ receive geometry information in the overlay
   └─ convert product data points into screen positions
      └─ draw tooltips, labels, selected states, or other product UI
The geometry does the important work. ChartLens exposes the mapping between data space and screen space. The product layer decides what to draw on top.
In WiFi Lens, I can place SSID labels on a spectrum chart, show hover tooltips on a trend chart, or mark AP handoff events on a roaming timeline without changing the chart renderer.
ChartLens draws the chart. WiFi Lens explains what the chart means.
Geometry regions
Real charts need more than one rectangle.
A chart view has a full frame. Inside it, the plot area holds the curves. Axis labels need their own space. Product annotations need a safe region too.
If everything uses plotRect, labels cover curves. Tooltips get clipped. Axis labels compete with chart content.
ChartLens separates the regions:
Full chart frame: frameRect
├─ Plot area: plotRect
├─ Axis label regions: axisLabelRects
└─ Product annotation area: annotationRect
This is a small abstraction, but it removes a common layout problem. Each chart element can ask where it belongs instead of guessing.
annotationRect matters in WiFi Lens because some charts have dense labels. Persistent labels and callouts need a region that does not depend directly on the plot area.
Interaction without owning product state
Interaction needs the same separation.
Some chart components handle tap, hover, and selection internally. That works in demos. In a product, selection usually affects other views.
WiFi Lens connects charts to external state. A selected AP in a table may highlight a curve. A hover point may update a detail panel. A zoom range may change what another part of the screen displays.
ChartLens provides hit testing and callbacks. It does not keep the business state.
ChartInteraction
├─ hover: return the data point under the cursor
├─ tap: pass the nearest data point to the outside
├─ zoom: pass the new X-axis range after drag-to-zoom
└─ zoomGestureEnabled: enable or disable zoom gestures
The chart can process the click and send the result outward. The parent view decides how to use the selected point, hover state, and zoom range.
That boundary keeps ChartLens closer to infrastructure than product logic.
Extract first, improve through use
ChartLens is early.
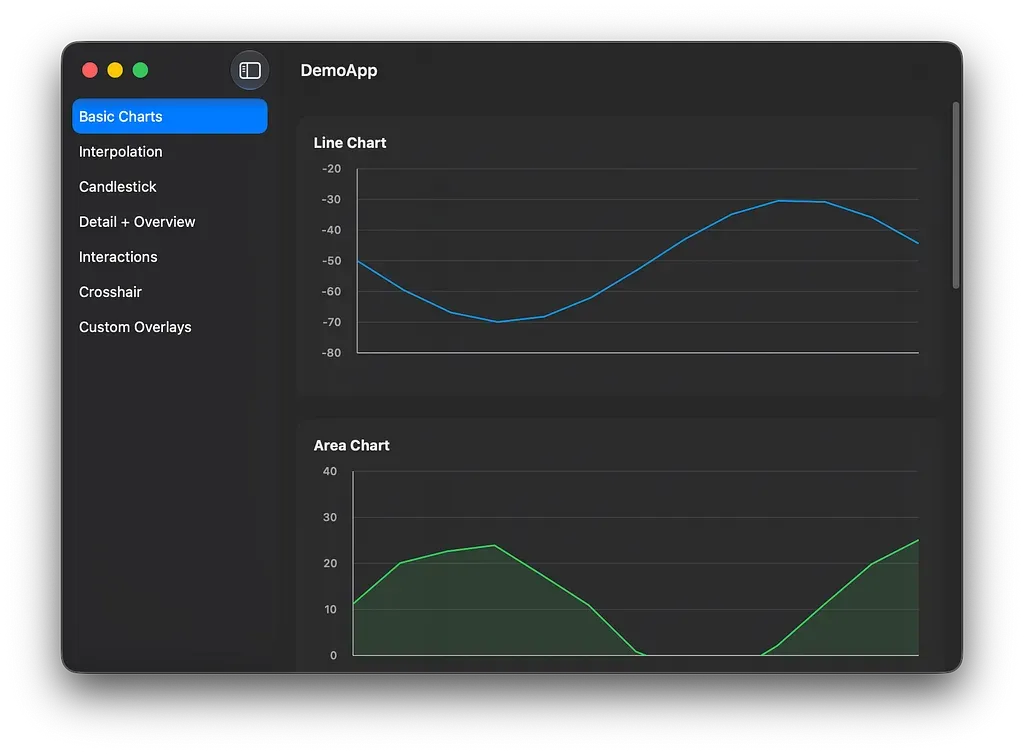
It supports line charts, area charts, dot charts, Gaussian curves, candlestick charts, CrosshairOverlay, RangeSelector, and DetailOverviewChart. It may gain bar charts, more style controls, better accessibility support, and broader platform coverage later.
The first goal was smaller: move chart behavior that already worked in WiFi Lens into an independent, testable, reusable module.
An abstraction should keep serving the product that created it. If WiFi Lens keeps using ChartLens, the library will keep meeting real constraints. If it stops helping WiFi Lens, the abstraction has drifted.
Closing thoughts
ChartLens came from a specific maintenance problem.
WiFi Lens needed spectrum views, RSSI trends, roaming timelines, and interactive overlays. I removed the Wi-Fi-specific names and kept the reusable pieces: rendering, coordinate mapping, interpolation, interaction, and overlay injection.
The result cleaned up WiFi Lens and gave me a chart layer I can reuse elsewhere.
If you build complex charts in SwiftUI, ChartLens may help you think through where your chart code should end and your product code should begin.
Links
ChartLens:
https://github.com/ShiinaLabs/chart-lens
WiFi Lens:
https://github.com/ShiinaLabs/wifi-lens